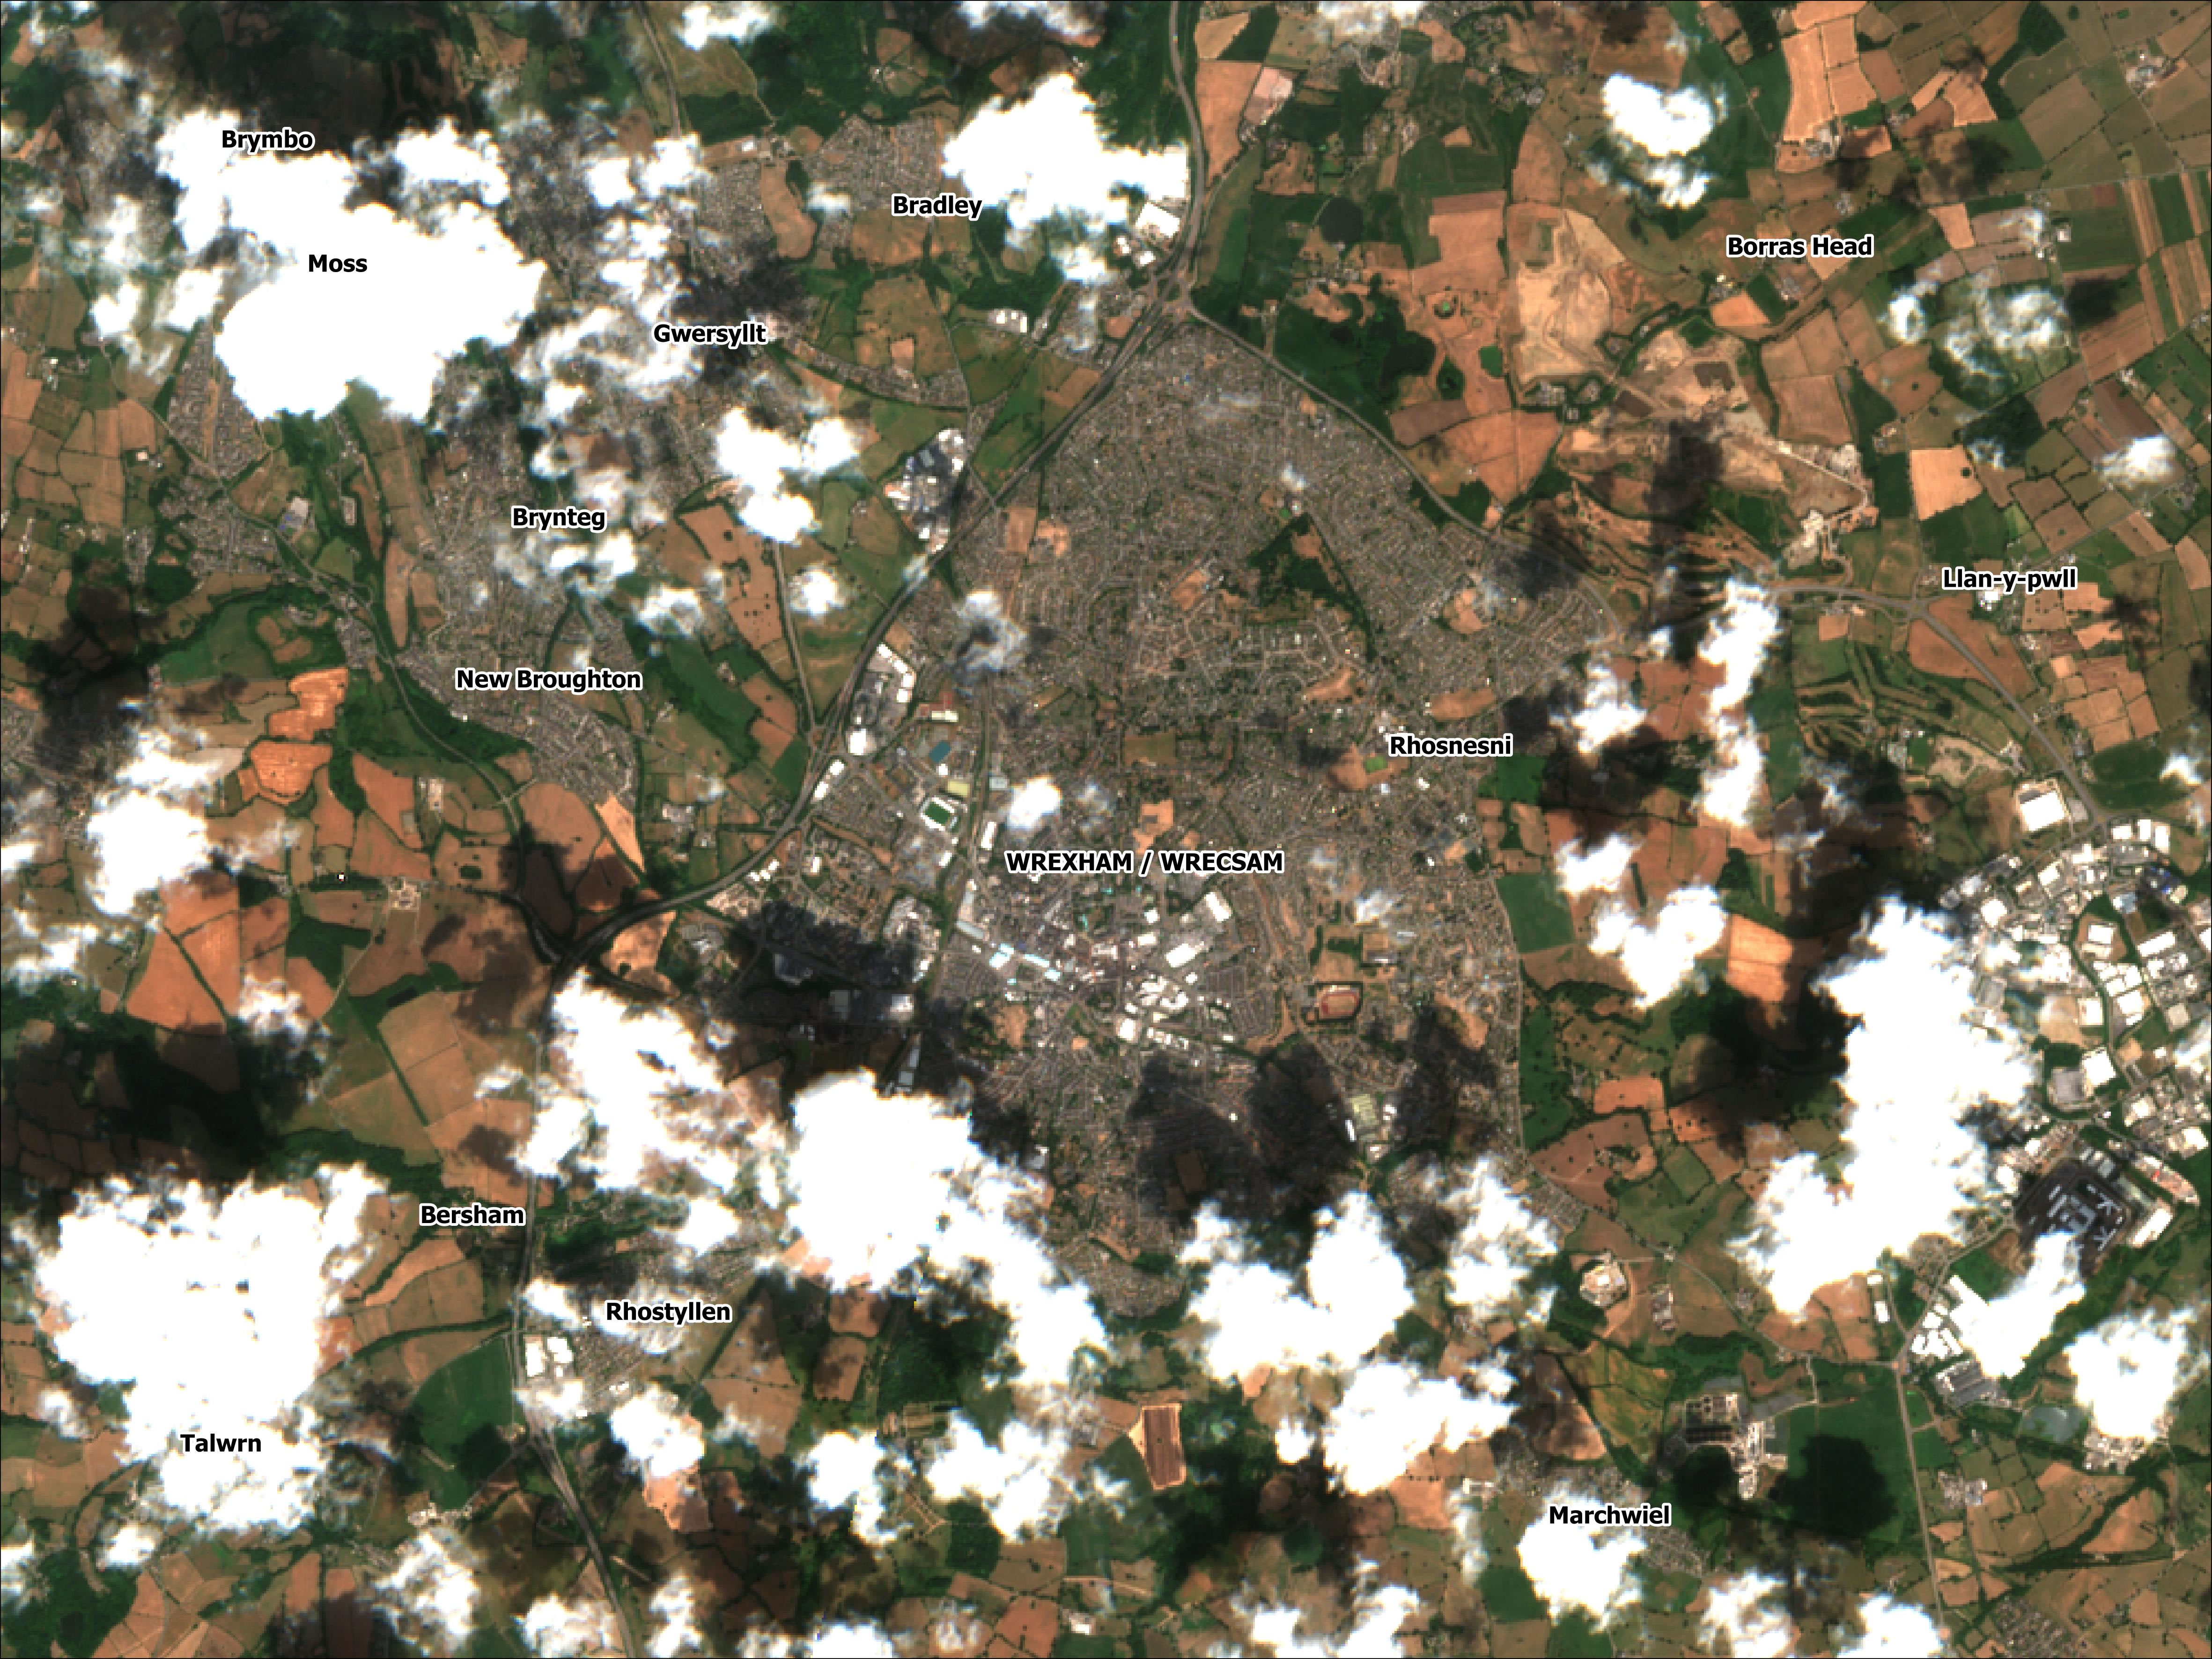
Satellite images show Wrexham turning yellow after heatwave
The recent heatwave has turned Wrexham’s lush green spaces into yellow dry patches of land.
The images on this article were taken by the EU Copernicus Mission Sentinel-2 observation satellites, operated by the European Space Agency, a pair of identical craft built by Airbus which fly a “sun chasing” moving orbit 500 miles above the Earth every 100 minutes and 40 seconds. Typically one of the satellites will pass over the UK every 2-3 days.
John Murray, a Researcher in the Geographic Data Science Lab at University of Liverpool extracted the shots and processed them using the ESA’s free SNAP Software toolset and kindly provided us with copies.
John explained to us that the data is captured in 12 different spectral frequency bands including visible red/green/blue and non-visible bands including infrared. Usually the non-visible frequencies are used to monitor vegetation, atmospheric conditions and other environmental metrics.
We have previously had a brief overview of the orbit cycle of each satellite, telling us it is 143 slightly shifted paths, to cover the entire planet in both directions which takes a full 10 days to complete. During that time it will pass over Wrexham twice, so together with sibling Sentinel-2B the town is scanned 4 times in in every 10 day period.
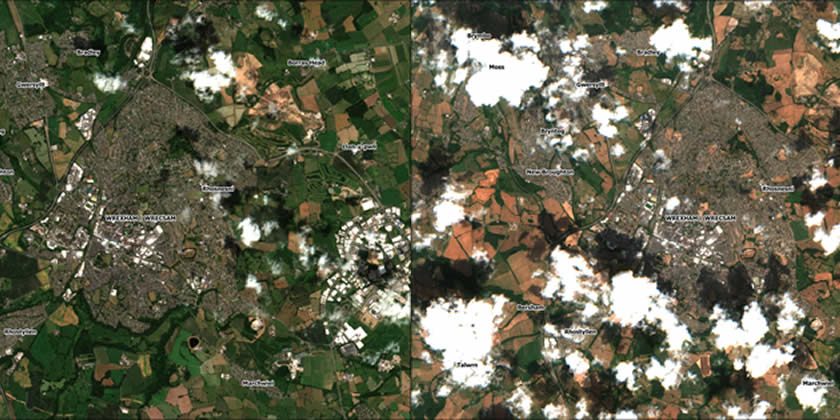
Below is a 1meg animation of the two images overlayed:

The two separate images can be found below, and if you click the image it will load the huge original files too.
Greener times:

After the heatwave:
As well as helping keep you informed on what Wrexham looks from space, John’s main research involves using artificial intelligence (AI) techniques to analyse and classify satellite images to study urban environments and analyse the risk of disasters such as flooding.
Other work mainly involves studying areas for vegetation cover (carbon offset), types of buildings (commercial, residential, retail etc), rivers and track changes to urban areas over time.
John says his main objective is to help insurance companies better understand risk in buildings insurance and has presented his work in Parliament in 2016, following the Carlisle floods, to investigate how technology can help in planning for and prevention of future flood events.
If you don’t already, we strongly recommend giving John a follow on twitter – @MurrayData
Images / reference points © Copernicus Sentinel & OS data 2018.
Spotted something? Got a story? Email [email protected]